Product Design & Data Visualization
Data-driven design, meticulously detailed & down-to-earth.
I bridge complex, analytical systems with clear, human user experiences — from enterprise product design to the data visualization work where it all started.
// Product design · AI in the workflow
Product design case studies
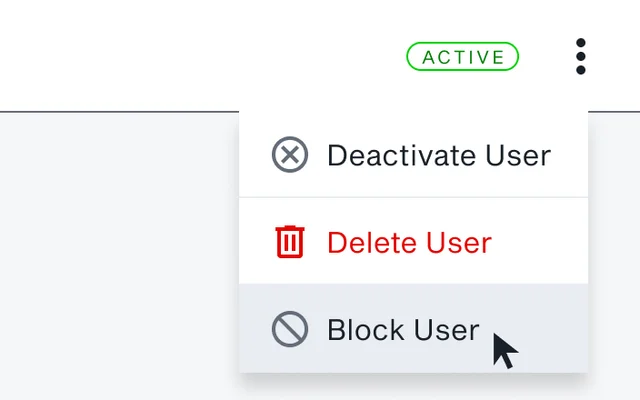
Account BlockingCutting a fraudster's 30-minute window to seconds
A request to rebuild a cleanup tool became a fix for the problem it was cleaning up after.
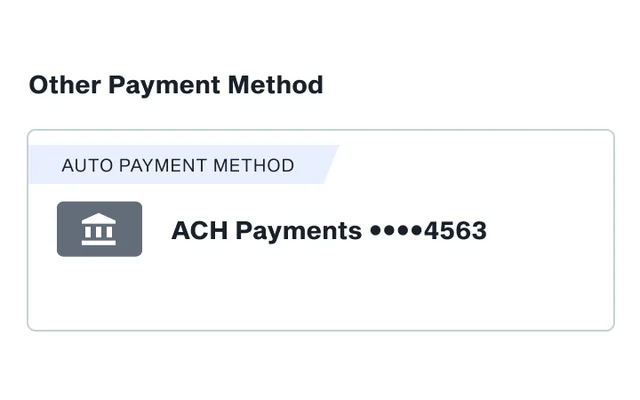
ACHA switch to pass on credit card fees while allowing customers a fee-free way to pay
A company decision to stop absorbing card fees needed a fee-free way out for customers, and the only way out was a phone call.
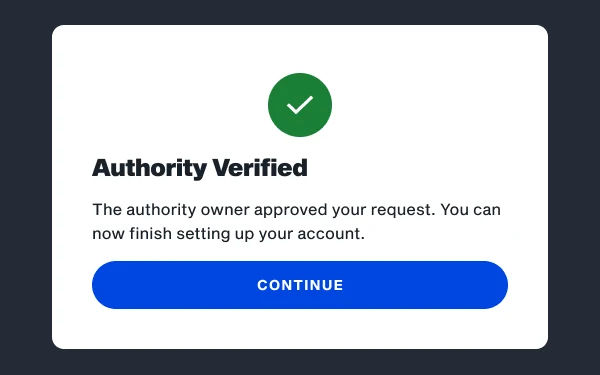
SSU VerificationA Gate at the Front Door
Anyone could sign up for our freight load board and get past its identity check. Verifying them fell to compliance specialists, by hand.
// Data visualization
Data visualization
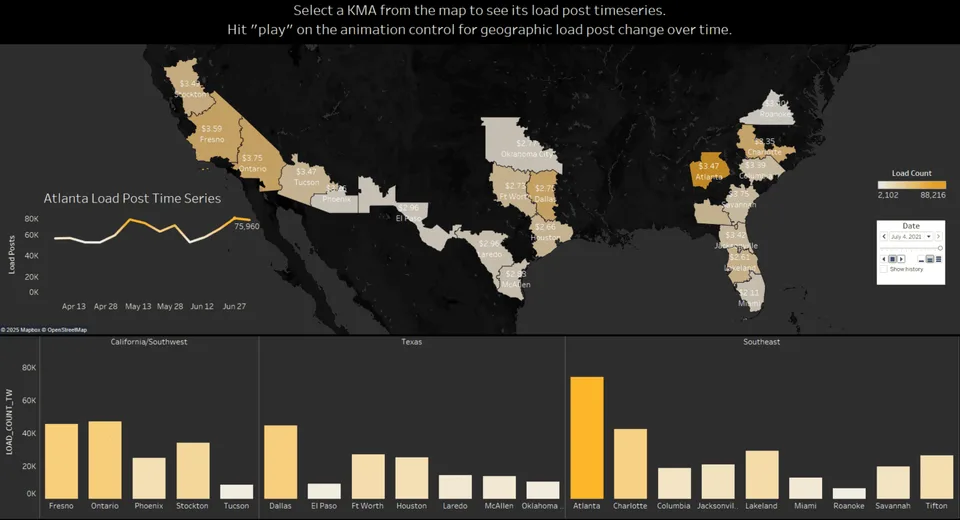
Spring Shipping Season
From joy-plot experiments to an animated dashboard, feeding a published white paper on produce season.
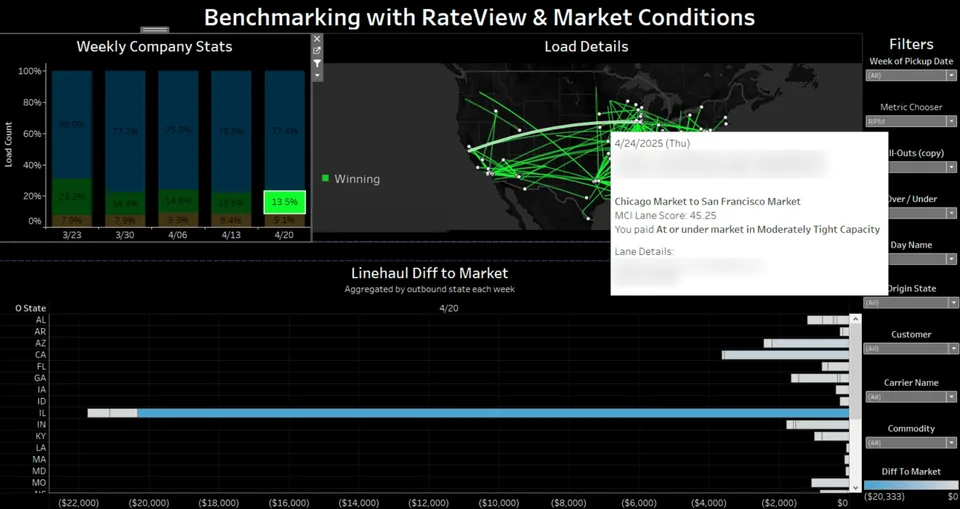
Workflow OptimizationPutting a New Metric to Work
A benchmarking dashboard that put a new capacity metric to work, set up for 25 customers.
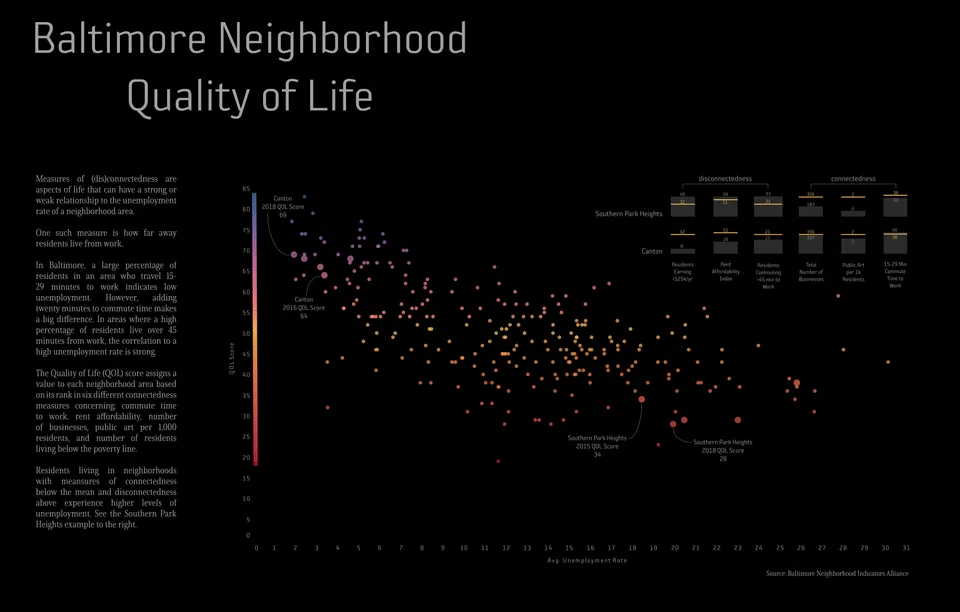
Baltimore Neighborhood Quality of Life
An R analysis and Illustrator poster scoring every Baltimore neighborhood on quality of life.
// Data visualization
Gallery
 (opens full size)
The Great Fire of London
A challenge to modernize a historical visualization with today's tools. I built custom shapefiles to recreate the burn area from Hollar's 1667 map, then layered in present-day mean household income by ward to show who the fire would affect today.
Tableau · custom shapefiles
 (opens full size)
Florida Seagrass Food Webs
Two ways to show who eats whom among the 48 organisms in a Florida seagrass food web. The network diagram is my pick: it gives a quick sense of the hierarchy, much like a word cloud does for words. Data from Christian and Luczkovich (1999).
Flourish
 (opens full size)
Weekly Spot History with Forecast
A research-and-development design for a new way to view rates over time. It blends historical, current, and forecast rates into one continuous timeline. A version of this design was featured on DAT’s website.
Tableau
// About
About me

My love for analytics and data visualization took hold at Certified Languages International, where I spent nine years in sales operations and the company sponsored my Tableau training. At the end of 2017, DAT Freight & Analytics gave me the chance to shift into an analytics career, starting as a Sales Operations Analyst who brought disparate data sources together into dashboards the sales team could work from. That work led DAT to sponsor my Master's in Data Analytics & Visualization at MICA.
Over eight years at DAT, I evolved from a hands-on analyst into a data-driven consultant, then a people manager who scaled a team to $10–11M in sales. Across every role, the consistent pattern is turning tactical, one-off work into reusable systems, like dashboards, rubrics, pipelines, and design workflows, that outlast the original project.
Since September 2025, I've been a Product Designer at DAT, working AI-first: I design directly in the application's codebase, iterate with stakeholders, and hand off screens built with the design system's own components. The throughline is the same as it's always been: finding leverage points and building the structure that gets people past technical or organizational roadblocks.