Using Metrics to Make Optimize Workstreams
Project Overview + Objective
Evolving through cross team collaboration with sales and product team members, this project was the result of internal and external presentations, conversations, and teamwork. After studying relationships between two metrics and presenting on the topic at a couple industry conferences, I was actively involved in conversations on how to put the metric to work for our customers. A sales team member paired me with a customer to develop a workflow incorporating the two metrics. From there, I developed the following dashboard.
Data Exploration + Design Iteration
This dashboard incorporates elements from customer feedback I gathered during phone calls and conferences. I was working with a relatively new metric released into the market, so understanding how our customers incorporated it into their workstreams was essential. For customers, benchmarking rates was a familiar exercise. Introducing a second new metric to the workstream allowed customers to begin benchmarking in more nuanced ways.

Customer-facing product.
Final Design + Product
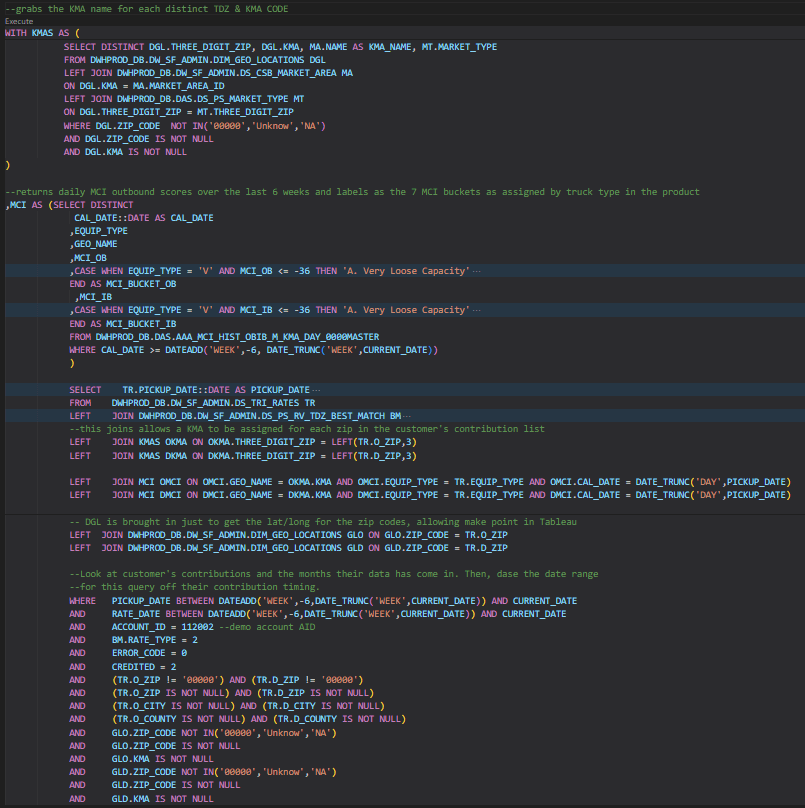
Supported by custom SQL script, the dashboard is powered by calculation written into the query code. I developed the custom calculations after hearing feedback from customers on how they would like to use the metric.
Volume up for explanation.