Spring Shipping Season
Project Overview + Objective
For this Spring Shipping project I served as a data analyst, visualizer, and subject matter expert on a cross-team collab with design and marketing team members. The message they wanted to communicate in marketing collateral: Inform readers on when and where freight capacity will be tight.
My goal was to tell the story of produce freight ramping up during the spring growing season from April to July and highlight how freight travels from southern to northern markets influencing freight market capacity.
Data Exploration + Design Iteration
The team wanted to explore if a "Joy Plot" visualization would work for this data story. Below are some design trials I tried in Tableau and presented to the team. Freight capacity from outbound freight market (x-axis) areas is plotted horizontally over time (x-axis)
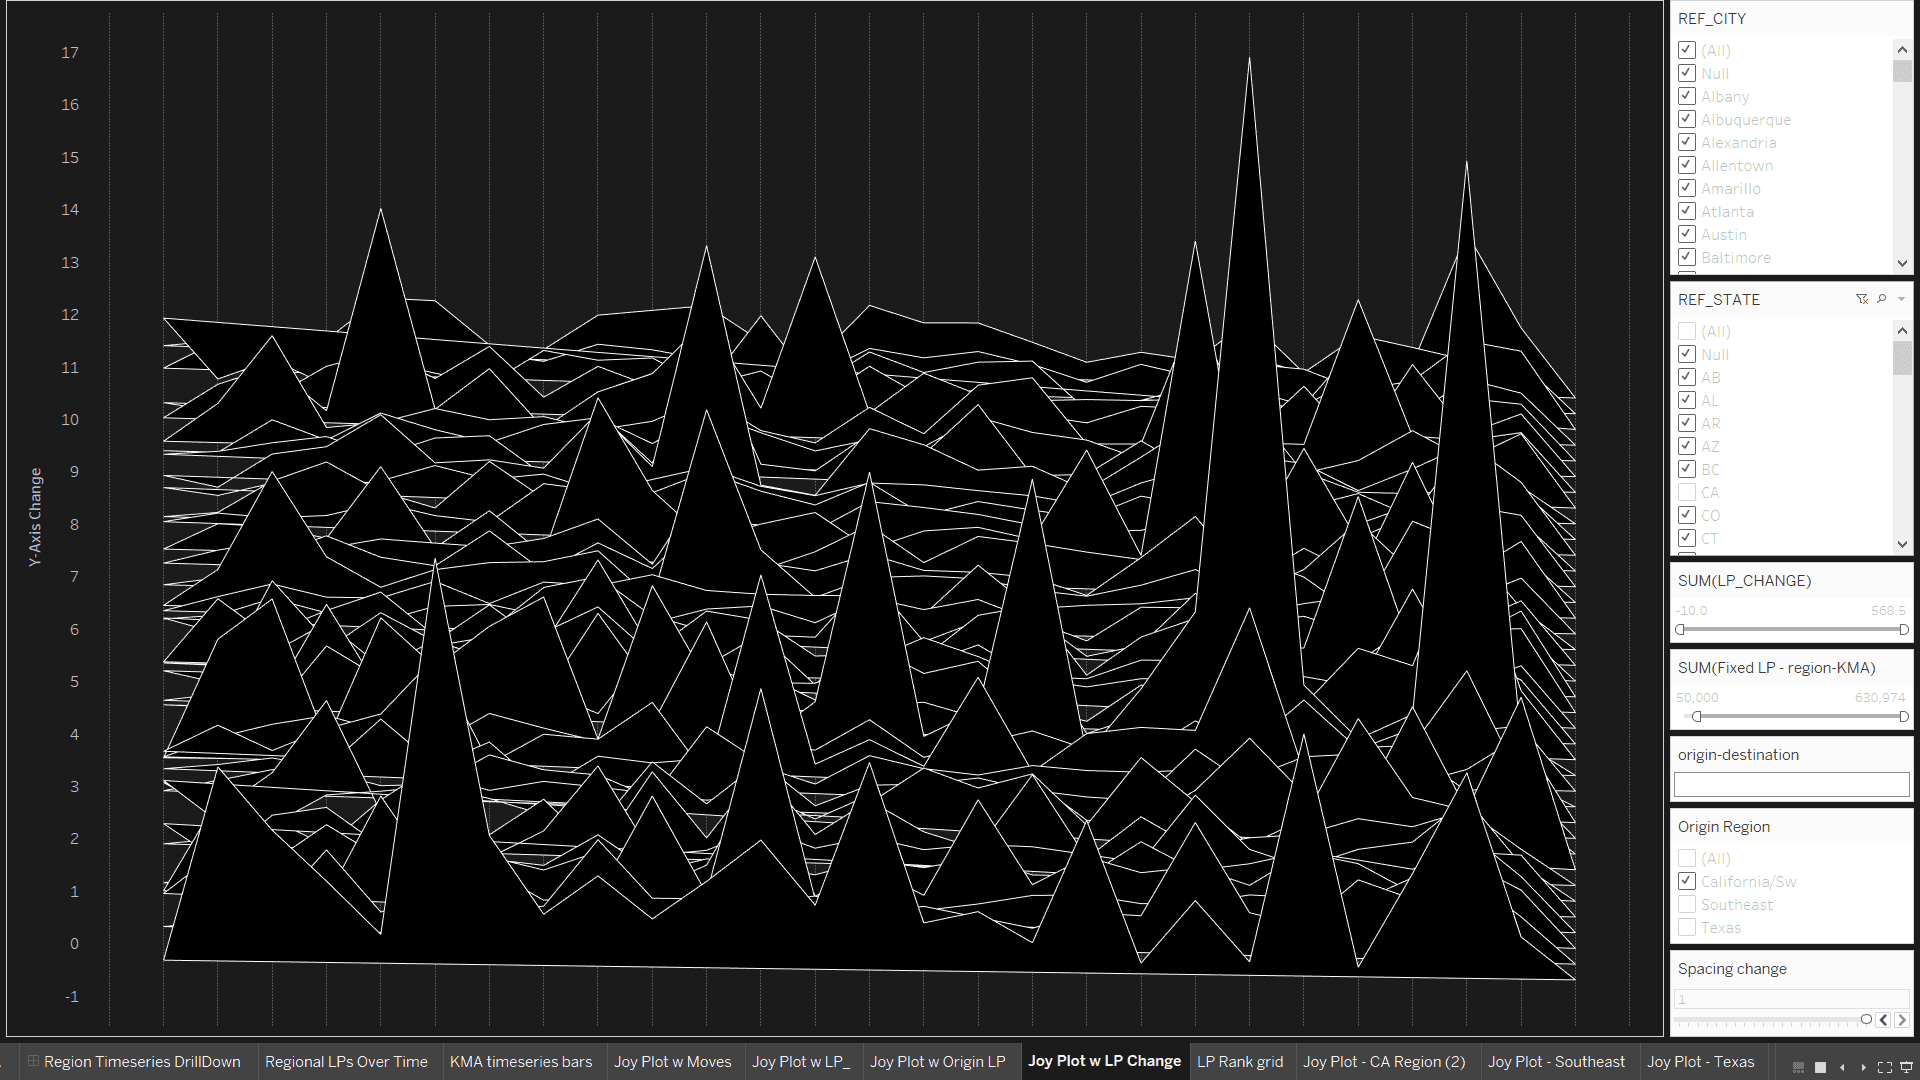
Joy Plot Iteration 1

Joy Plot Iteration 2
Final Design + Product
The Joy Plot iterations were fun to create but did not clearly portray the southern to northern freight movement over time in concise way that would reach our audience with the intended message. Adding color, I started to see the freight trends we were looking to communicate to our readers.
From here, I decided to create an animated dashboard for the teams to reference while creating their final collateral piece. Below is an example of the presentation I gave to teams while rolling out the dashboard to these internal stakeholders.
The final piece, created by a design colleague was a two-page white paper published in spring '23 and was used as marketing collateral and in blog posts.

Volume up for explanation.
